AlerTrade User Guide
Welcome to the help center. AlerTrade is designed to monitor the markets in real time and detect precise technical opportunities on your favorite stocks.
🎬 New to AlerTrade? Watch the 6-minute getting-started tour of the screen on a real replayed session (in French for now; English version coming soon).
▶ Watch the video🧑💻 User Info
This floating panel shows the user's information: login email address, subscription plan and end date.
It also lets you go back to the website (without losing your session), send Feedback, switch the language of the member area, or log out cleanly (a new magic link will be required at your next login).
🏛️ Environment & Quotas
The 📋 Your Plan panel summarizes your capabilities:
- Server: host system running the engine.
- Current plan: your subscription plan.
- Tickers: source and number of tickers allowed.
- Min interval: the fastest refresh rate allowed.
- Backtest: whether Backtest mode is available.
- Backtest speed: the maximum replay speed of your plan (x4, x9 or x15).
- Backtest depth: how far back the Backtest start date can go (6 days, 30 days with Ultimate).
- Notifications: browser notifications of combined alerts (Ultimate plan).
closed in the market line (top right, see Alert Display), the ▶️ Start button is blocked for real time to avoid data feed errors, but Backtest mode remains available.
📋 Ticker Source and Loading
To receive alerts, you first need to define the tickers to monitor:
- Default list: if nothing is selected or with the Discovery plan (
AAPL,TSLA,NVDA,AMD,MSFT,AMZN,META,GOOGL,PLTR,MU). - Predefined list: pick one of the lists offered.
- Custom file: depending on your plan, upload your own file. Required format: a CSV file with one ticker per line, no header.
Note: if your file exceeds your quota (e.g. 100 tickers for a plan limited to 50), the list is automatically truncated to the first items.
📺 Display Settings
These settings let you customize how alerts are displayed:
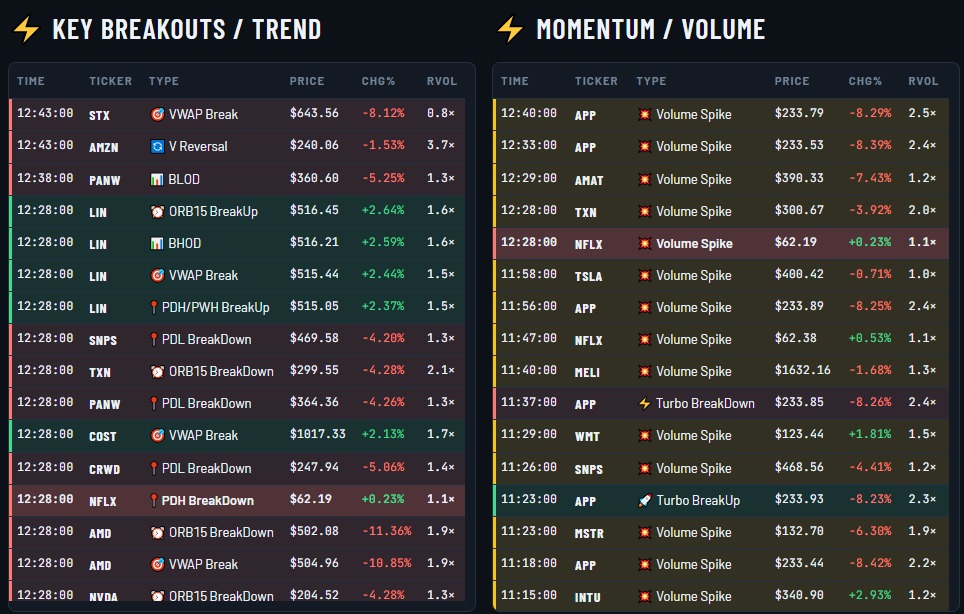
- Layout: the DOUBLE view splits alerts into two columns, Breakout/Trend alerts on one side and Momentum/Volume alerts on the other.
- Theme: the light or dark display automatically follows your computer's or phone's setting (system light / dark mode). The colors of each theme remain customizable.
- Refresh interval: how often alerts are updated. Keep in mind that alerts are generated from the last closed candles, so a shorter interval will not produce more new alerts.
- Important alerts only: shows only significant alerts, i.e. those with a significant price move confirmed by rising volume on the same candle (table below). Only the alerts of the combination are highlighted.
- Preferred trend: Both, Bullish or Bearish. Shows only alerts in that direction, in the tables and on the chart; alerts without a direction (volume alone) are then hidden. Combines with “Important alerts only”. Alerts are still detected and included in the CSV export.
- Show the Message column: untick it for a narrower alerts table (time, ticker, type, price, change %), handy with the chart on the right. The CSV export always keeps the message.
- Chart: shows or hides the intraday chart and sets its position (below the alerts or on the right). See the Intraday chart section.
- Show follow-up in the tables: adds to the alert tables what the price did after each alert (columns of your choice: +15 min, +30 min, +60 min, Close; off by default). The follow-through threshold (minimum move for an alert to have "followed through") is set at the top of the indicator settings, under the threshold unit. See the Alert follow-up and summary section.
| Price Condition (A) | Volume Condition (B) | Visual Result |
|---|---|---|
| BHOD, ORB BreakUp, VWAP UP, or bullish key-level break | VOLUME Breakout (same candle) | HIGHLIGHT (Up) |
| BLOD, ORB BreakDown, VWAP DOWN, or bearish key-level break | VOLUME Breakout (same candle) | HIGHLIGHT (Down) |
🔔 Detected Signals
AlerTrade monitors these specific setups:
Opening Range Breakout
Triggers an alert when a candle closes above the high or below the low of the first 5, 15 or 30 minutes of the session (periods of your choice, 15 minutes by default).
The price leaves the consolidation zone formed by the first X minutes of trading. It is a signal of the day's initial direction.
Confirmation margin (0.5% by default, or 0.2 × ATR): the close must clear the range high (or low) by at least this margin. Re-arm (0.25%, or 0.05 × ATR): a new alert is only possible after the price comes back inside the range by at least this distance. Without these two settings, a stock hovering around the level could trigger an alert every few minutes. From candle no.: no alert before this candle (default 60, i.e. 10:29 AM); breaks right after the range forms are the least reliable.
Calculation: Candle close vs Range High/Low ± margin (5, 15 or 30 min)
High/Low of Day
Alert when the close breaks above the day's high (BHOD) or below the day's low (BLOD) reached so far, by at least the breakout margin (default 0.25%, or 0.05 × ATR).
Re-arm: a new break on the same side is only announced after the close pulls back at least the re-arm value (default 0.4%, or 0.2 × ATR) from the day's high (or low). From candle no.: no alert before this candle of the session (default 60, i.e. 10:29 AM); breaks at the very start of the session are unreliable.
Calculation: Close > day's high before the candle × (1 + margin)
Key levels (PMH / PDH / PWH)
Flags breaks, up or down, of the levels traders draw every morning: the pre-market high / low (PMH / PML), the previous day high / low (PDH / PDL) and the previous week high / low (PWH / PWL). Each family can be turned on separately (default: previous day and previous week).
Default confirmation margin 1% (or 0.2 × ATR): the close must clear the level by at least this margin. Neutral zone 0.02% (or 0.025 × ATR): only a real return to the level re-arms the alert (retest, then a new break). Nearly equal levels are grouped (e.g. PDH/PWH). From candle no.: no alert before this candle (default 30, i.e. 9:59 AM); crossings are tracked from the open, so a gap open beyond a level is not announced as a break. Levels are drawn as purple dotted lines on the chart.
Calculation: (Close - Level) / Level beyond the margin
Volume Weighted Average Price
Detects critical crosses of the volume-weighted average price line.
Default threshold ±1.5% (or 0.35 × ATR). Distance tracked from the 15th minute; From candle no.: no alert before this candle (default 60, i.e. 10:29 AM).
Default neutral zone ±0.2% (or 0.05 × ATR), always smaller than the threshold. After an alert, the price must return to the neutral zone before an identical new alert is possible.
Calculation: (Close - VWAP) / VWAP
Turbo Break
Flags a sudden price acceleration over a very short period (1 minute).
Default threshold ±0.75% (or 0.15 × ATR). From candle no.: no alert before this candle (default 60, i.e. 10:29 AM); sharp moves at the start of the session are mostly noise.
Calculation: (Close - Previous candle close) / Previous close
Volume Breakout
Flags a sudden volume acceleration over a very short period (1 minute).
Default spike ratio 6× (4× before 11/04/2026): on its own, a volume spike does not tell the direction; it mainly confirms a breakout (combined alerts, see above). Extreme Reversals are no longer part of combinations: a reversal with a volume spike is more often the end of a move. Active after 10 minutes of trading; the average covers the previous 20 candles. One alert at the start of a series of high-volume candles. The 3:59 PM candle, inflated by the closing auction on every stock, does not trigger an alert.
Calculation: Candle volume / Average volume of the previous 20 candles
Extreme Reversals
Flags a sharp V-shaped reversal: a fast drop (or rise) followed by a clear recovery in the other direction.
By default: a move of at least 1.5% (or 0.3 × ATR) within 10 minutes, then a retrace of at least 50% of that move within the next 5 candles, on a green (bullish reversal) or red (bearish) candle. One alert per bottom or top; these values are adjustable. From candle no.: no alert before this candle (default 60, i.e. 10:29 AM).
Calculation: Retrace = (Close - Low) / (High before the dip - Low)
Time-of-day RVOL (relative volume)
Compares the volume traded since the open (9:30) with the stock's usual volume at the same time of day: the median of the last 20 complete sessions. 2× = twice as active as usual at this time; 0.5× = half as active. Unlike Volume Breakout (a single minute), RVOL measures interest in the stock over the whole session. Included in the Ultimate plan and the Discovery trial.
Shown from 9:45 (9:45 candle) in an RVOL column of the alert tables, the monitored tickers list and the CSV export; updated with each new closed candle. "—": value not available yet (references loading, about one minute after Start) or ticker served by the backup source.
"📊 RVOL" settings section: alert (off by default) when the chosen thresholds are crossed (2× and 3× by default), once per threshold per session; sound of your choice. Breakout filter: ORB, BHOD / BLOD and key level alerts are kept only if RVOL reaches the chosen minimum (unknown RVOL: alert kept). In DOUBLE view, RVOL alerts are in the Momentum column.
Calculation: Cumulative volume since 9:30 / Median cumulative volume at the same minute (20 sessions)
Turn on only the settings and thresholds that match your trading style.
This keeps your alert screen free of unnecessary notifications.
📏 Thresholds in % or in × ATR
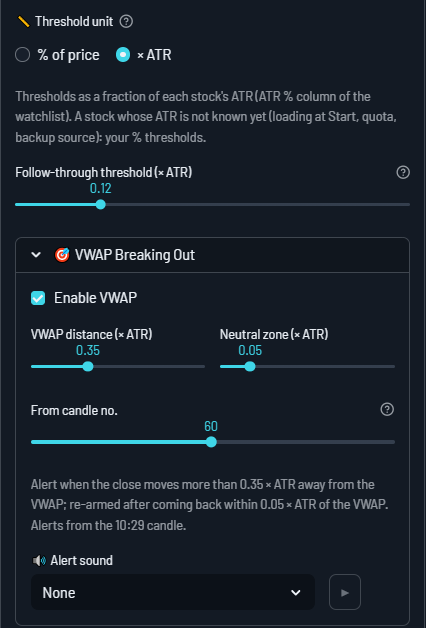
At the top of the indicator settings, Threshold unit sets how signal distances are expressed: in × ATR (default since 11/04/2026, and for the three styles) or as a % of price. Until a ticker's ATR is known (start of the session, new ticker), its alerts use the % thresholds. Just below, the alert follow-through threshold uses the same unit.
The ATR (Average True Range) is the stock's typical daily move, as a % of its price. AlerTrade uses a "robust" ATR: the median of the last 14 sessions, so that an exceptional day (an earnings release) does not distort the value for weeks. It is calculated from our main data source, like the alerts.
Why it helps: the same percentage does not mean the same thing for a calm stock and a volatile one. Example with a VWAP alert:
| AAPL (price $344.63, ATR 1.79%) | MRVL (price $196.40, ATR 9.01%) | |
|---|---|---|
| 1% of price threshold | $3.45, more than half of its typical day: rare alert | $1.96, a tenth of its typical day: alert all the time |
| 0.25 × ATR threshold | 0.45% ($1.54), a quarter of its typical day | 2.25% ($4.42), a quarter of its typical day |
As a % of price, every stock must move by the same percentage: too demanding for calm stocks, not enough for volatile ones. In × ATR, every stock must move by the same fraction of its usual move: each alert means the same thing, whatever the stock. × ATR is most useful with lists that mix calm and volatile stocks (Nasdaq 50, S&P 50, your own lists); with a homogeneous list, both units are equivalent.
Thresholds concerned: VWAP distance and neutral zone, BHOD / BLOD margin and re-arm, key level margin and neutral zone, ORB margin and re-arm, Turbo, Extreme Reversals minimum move and the alert follow-through threshold. Volume thresholds (ratio, RVOL) and ORB periods do not change. Default values in × ATR: VWAP 0.35 (neutral zone 0.05), BHOD / BLOD 0.05 (re-arm 0.2), key levels 0.2 (0.025), ORB 0.2 (0.05), Turbo 0.15, Extreme Reversals 0.3, follow-through 0.12. Your % and × ATR values are both kept: switching units loses nothing.
In × ATR, the monitored tickers list shows an ATR % column, and alert messages give the threshold actually applied to the stock, in %. A stock whose ATR is not known yet uses your % thresholds: while loading at Start (about one second per stock), for a stock served by the backup source, or if our history quota is reached (rare).
📈 Intraday chart
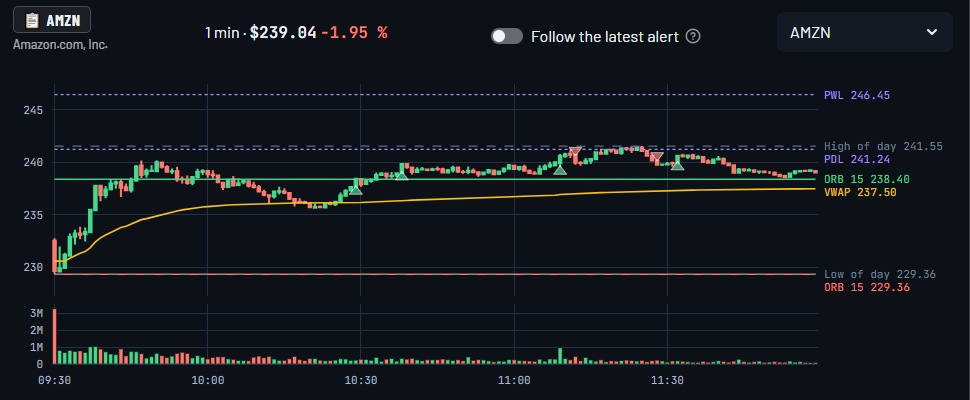
The chart shows the 1-minute candles of the selected ticker, the same ones the alerts analyze, with:
- the VWAP, the high / low of day and the ORB levels set in your settings, each labeled with its value on the right;
- alert markers: ▲ below the candle for a bullish alert, ▼ above it for a bearish or neutral alert, in the color of the table row. Hover over a marker to read the candle's alerts;
- the volume below the prices, as bars to compare candles with each other (no quantities: our data source only sees part of the trading);
- a crosshair that follows the mouse, showing the price and time under the cursor.
Follow the latest alert (on by default) automatically shows the ticker of the latest alert. Turn it off to pick a ticker from the list: the chart then stays on that ticker.
At the top left of the chart, the 📋 TICKER button copies the symbol of the displayed ticker (e.g. BRK.B), to paste into the symbol search of TradingView or your broker (Ctrl+V, then Enter; in TradingView, first click the symbol name at the top left: pasted on the chart, it would become a text drawing). Below the button: the company name.
In real time, the price shown at the top of the chart is that of the current candle, updated at every refresh; the alert table stays on the last closed candle. In Backtest, the chart stops at the simulated minute.
Zoom and pan: with the mouse or the buttons at the top right of the chart. The view is kept for each ticker from one refresh to the next; double-click to return to the full view.
By default, the chart is On the right of the alerts: a vertical bar between the two areas lets you adjust their width with the mouse. In Display settings → Chart, you can hide it or place it Below the alerts.
🧾 Ticker portrait
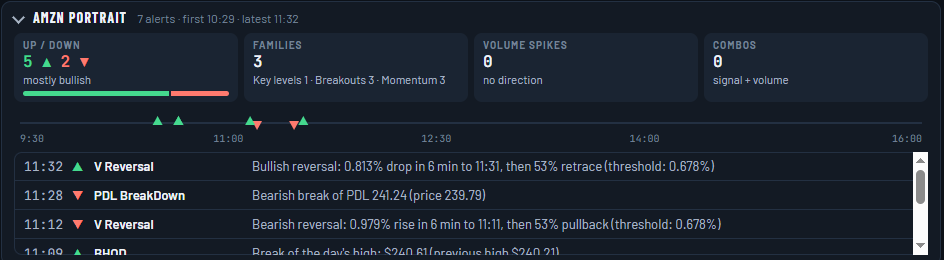
Below the chart, the portrait sums up all of the session's alerts for the displayed ticker:
- Up / down: number of ▲ and ▼ alerts, with a bar and a trend (mostly bullish, mostly bearish, mixed);
- Families: key levels, breakouts (ORB, BHOD / BLOD, VWAP), momentum (Turbo, V reversal), volume, RVOL;
- Volume spikes (no direction) and Combos (price signal and volume spike on the same candle);
- a mini timeline from 9:30 AM to 4:00 PM and the list of alerts, latest first (★ = combo).
Click an alert in the list or on the mini timeline: the chart centers on ± 30 minutes around its candle (double-click the chart = full view). Click the portrait header to collapse or expand it.
Between the chart and the portrait, a horizontal divider sets their height with the mouse (or the keyboard arrows); double-click = default (70% for the chart). The setting is kept in your browser.
📅 Simulation Mode (Backtesting)
- LIVE mode: direct connection to the data feeds for near real-time trading. Real-time data comes from a broker, with an automatic backup source if it is unavailable.
- BACKTEST mode: replay a past session (up to 30 days back with Ultimate, 6 days with Premium and the trial; your plan's limit is shown in the 📋 Your Plan panel), using historical data from the same broker as real time (same candles). If it is unavailable, the whole day is loaded from the backup source.
Use Backtest mode at up to x15 speed (depending on your plan: x4 during the Discovery trial, x9 with Premium, x15 with Ultimate) to replay a full day in less than half an hour.
The 🔄 Reset simulation button is required if you change the date.
💾 Saved Preferences
🌩️ Your Setup in the Cloud
The following items are automatically linked to your account:
- Indicator configurations: active signals, trigger thresholds, threshold unit, sounds and notifications, grouped into named configurations (see below).
- Sounds: a sound of your choice for each signal (Double beep, Ding, Chime, Rise, Fall, Sonar, Urgent, Cash register, or none), to preview with the ▶ button; in the 🔊 Sounds and notifications section: volume, sound for combined alerts and a "sound by direction" option (Rise for a bullish alert, Fall for a bearish one). One sound per scan, the one of the most important alert.
- 🔔 Browser notifications (Ultimate plan): in the same section, tick the box and save your settings; the first time, click Allow in the banner at the bottom of the page. You then get a notification for each combined alert (highlighted) when the AlerTrade page is not in front (another tab, another window, your broker's platform). To avoid overload: never for single alerts, only in the direction of the Preferred trend, at most one per ticker every 5 minutes, and several tickers in the same minute are grouped. The notification stays on screen until you close it or return to AlerTrade; the next combos are added to it (most recent at the top). Clicking the notification brings you back to AlerTrade. Notifications blocked by mistake: click the icon left of the address (site settings or padlock) and allow them for alertrade.ca. Nothing shows up: check that your browser's notifications are turned on in Windows (Settings → System → Notifications) or macOS, and that Do Not Disturb is off.
- Visual design: custom color palettes for the Light and Dark themes.
The Default values button puts the indicator sliders back to their original values without deleting anything; the colors screen has its own reset button.
🎨 Three setting styles: Reactive, Balanced, Selective
At the top of the 💾 Configuration menu, three ready-made styles set every signal at once: thresholds, neutral zones, re-arms and the time of the first alerts. They were tuned on 6 months of sessions replayed minute by minute (50 Nasdaq stocks, May to November 2026), then measured over a full year (November 2025 to November 2026), comparing each signal with chance: the share of alerts followed by a move in the announced direction, versus that of ordinary minutes taken at the same times of day. All three use × ATR (see above). Balanced is the default style.
| Style | Alerts per ticker per session | First alerts | Combined alerts (50 tickers) | Character |
|---|---|---|---|---|
| ⚡ Reactive | ≈ 6 | from 9:59 AM | ≈ 7 per session | lower thresholds: more opportunities, earlier, but more noise |
| ⚖️ Balanced (default) | ≈ 3 | mostly from 10:29 AM | ≈ 2 to 3 per session | the best trade-off between the number of alerts and their reliability |
| 🎯 Selective | ≈ 1 to 2 | mostly from 10:29 AM | ≈ 1 per session | only the strongest moves |
Over the measured period, Balanced and Selective alerts were followed by a move in the announced direction slightly more often than Reactive alerts (about 6 points above chance, versus 4 for Reactive), including over November 2025 to April 2026, a period not used for the tuning. These are past statistics, with no predictive value and no promise of gains.
- How to choose: Reactive if you follow a few tickers closely and want to see everything coming; Balanced for a list of 20 to 50 tickers; Selective for a long list, or to be interrupted only by the clearest moves.
- A style only changes detection: your sounds, notifications and follow-through threshold are kept when you switch from one to another.
- Styles cannot be changed: start from one, adjust a slider, then 📄 Save as… to keep your variant.
💾 Saved configurations
You can keep several sets of indicator settings, for example a "Cautious" configuration as a % of price and an "Aggressive" one in × ATR, and switch between them in one click. Number of configurations by plan: 2 (Discovery), 5 (Premium), 20 (Ultimate).
- 💾 Configuration menu (at the top of the Indicator settings): choosing a line loads it. The three styles (Reactive, Balanced, Selective) come first and are never overwritten; your configurations follow.
- ✏️ Modified, not saved: your sliders differ from the loaded configuration. If you switch configurations at that point, AlerTrade asks for confirmation so you don't lose your changes.
- 💾 Save "name" updates the configuration shown; 📄 Save as… creates a new one (title and description) without touching the previous one. From a style, only Save as is available.
- ⚙️ Manage: change the title or description, or delete the configuration (after confirmation); the Balanced style is then reloaded.
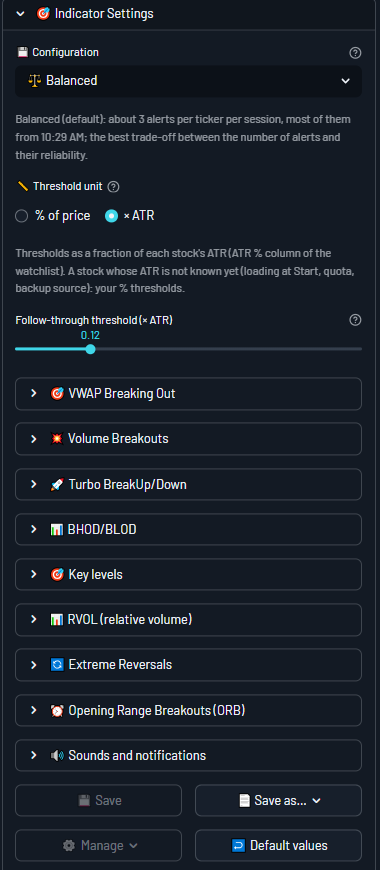
Each session keeps track of its configuration: it appears in the end-of-session summary and in the CSV export (Configuration and Settings code columns). The settings code identifies exactly the detection settings used: two exports with the same code ran with the same settings, even if the configuration was renamed in between. Handy for comparing the same session replayed in Backtest with several configurations.
🔄 Page Reload
If you reload the page (F5 key) during your session, your sidebar settings are kept: layout, refresh interval, alert filter, ticker source and list, and indicator and chart settings. Your alerts and the state of each signal are kept too: a reload does not recreate alerts you already received.
🚀 Running and Maintenance
▶️ Start: connects to the data feeds. You can close the sidebar afterwards. At startup, each ticker's situation is established from the previous candle: only breakouts that actually happen are reported.
⏹️ Stop: stops the feed and processes. No more alerts are generated.
The 🗑️ Clear alerts button empties the table without interrupting the analysis.
Up to 2,000 alerts are displayed. Beyond that, an automatic purge removes the oldest ones.
🏁 End of Session
When the market closes (4:00 PM New York time), monitoring stops and a summary appears: period, number of alerts generated and number of tickers monitored. The 📥 Download alerts (CSV) button lets you save all the session's alerts (Excel-compatible file), followed by the alert summary (see below). Alerts stay displayed until the next ▶️ Start. With the Ultimate plan, the session is also saved to your 📊 Analytics.
📊 Alert follow-up and summary
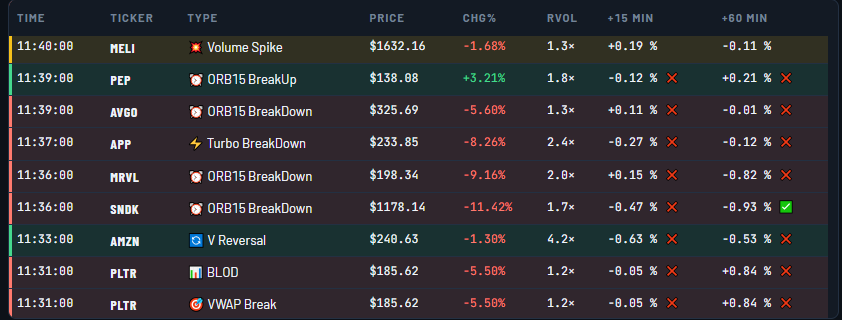
For each alert, AlerTrade records what the price did next: the change 15, 30 and 60 minutes after the alert and at the close (3:59 PM candle), plus the best and worst move in the following hour. It uses the candles already analyzed: nothing is slowed down.
- Followed through ✅ / not followed ❌: an alert has "followed through" if the price moved at least the follow-through threshold in the announced direction (bullish: up; bearish: down). Set the threshold at the top of the indicator settings, under the threshold unit (0.5% by default, or 0.12 × ATR); it is saved with your settings, and changing it also re-evaluates past alerts. Alerts without a direction (Volume spike, RVOL) only show the change.
- ⏳: checkpoint not reached yet. —: not reached at Stop or at the end of the session; the Close column is only filled if the session runs until 3:59 PM.
- In the tables: tick "Show follow-up in the tables" (Display settings) and choose the columns (+15 and +60 min by default).
- Alert summary: one row per alert type and direction, plus combined alerts and (depending on plan) alerts with an RVOL of at least 2×: number of alerts, share of alerts that followed through at each checkpoint, median move at 30 minutes, best and worst move over 60 minutes. These last three are measured in the direction of the alert: + = favourable, − = adverse. The summary covers all the session's alerts, including those hidden by your display filters. It is available during the session (collapsed "📊 Running summary" panel) and in the end-of-session summary.
- CSV export: changes at +15, +30, +60 min and at the close, best and worst move over 60 min.
Follow-up columns in the alert table:
End-of-session alert summary:
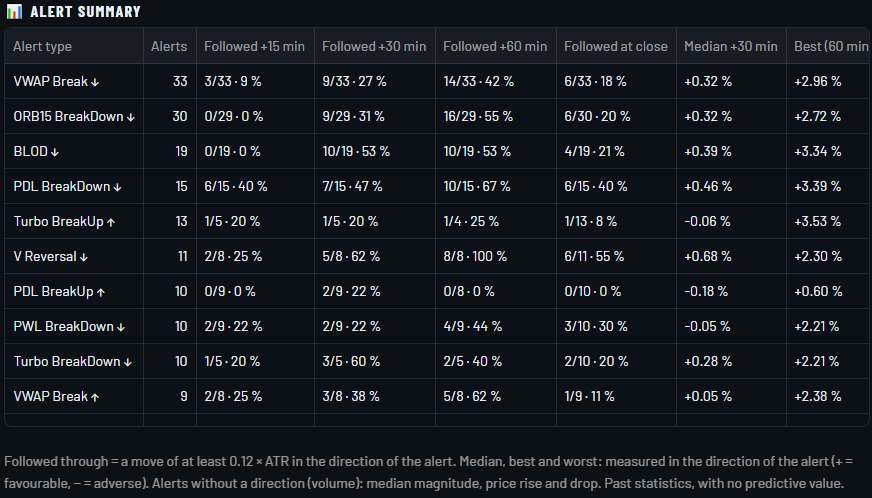
These are past statistics, with no predictive value and no promise of gains. A single session mostly reflects the day's trend: on a down day, bearish signals look excellent and bullish ones poor. Compare several sessions (in Backtest) before drawing conclusions about your settings.
📈 Analytics (Ultimate plan)
A session's summary disappears at the next Start; the 📊 Analytics tab, next to the 🔔 Alerts tab, keeps your sessions and helps you judge your settings over time and compare several configurations on the same day. Monitoring continues while you look at your analytics.
- Saved sessions: each session (real time or Backtest) is saved at ⏹️ Stop or at 4:00 PM, with its configuration, ticker list, period and alerts; the end-of-session summary says so. Sessions shorter than 30 minutes (trials) are not saved. Kept for 90 days.
- Checkpoint and follow-through threshold (top of the tab): shared by all analyzed sessions. It starts at your follow-through threshold; changing it recalculates every session at the same threshold so they stay comparable.
- Full sessions: a session is full if it starts by 9:45 AM and runs until 4:00 PM. Overview and History only count those (a morning alone would skew the comparison between days); tick Include partial sessions to add them. The same day replayed several times with the same configuration counts once (the most recent).
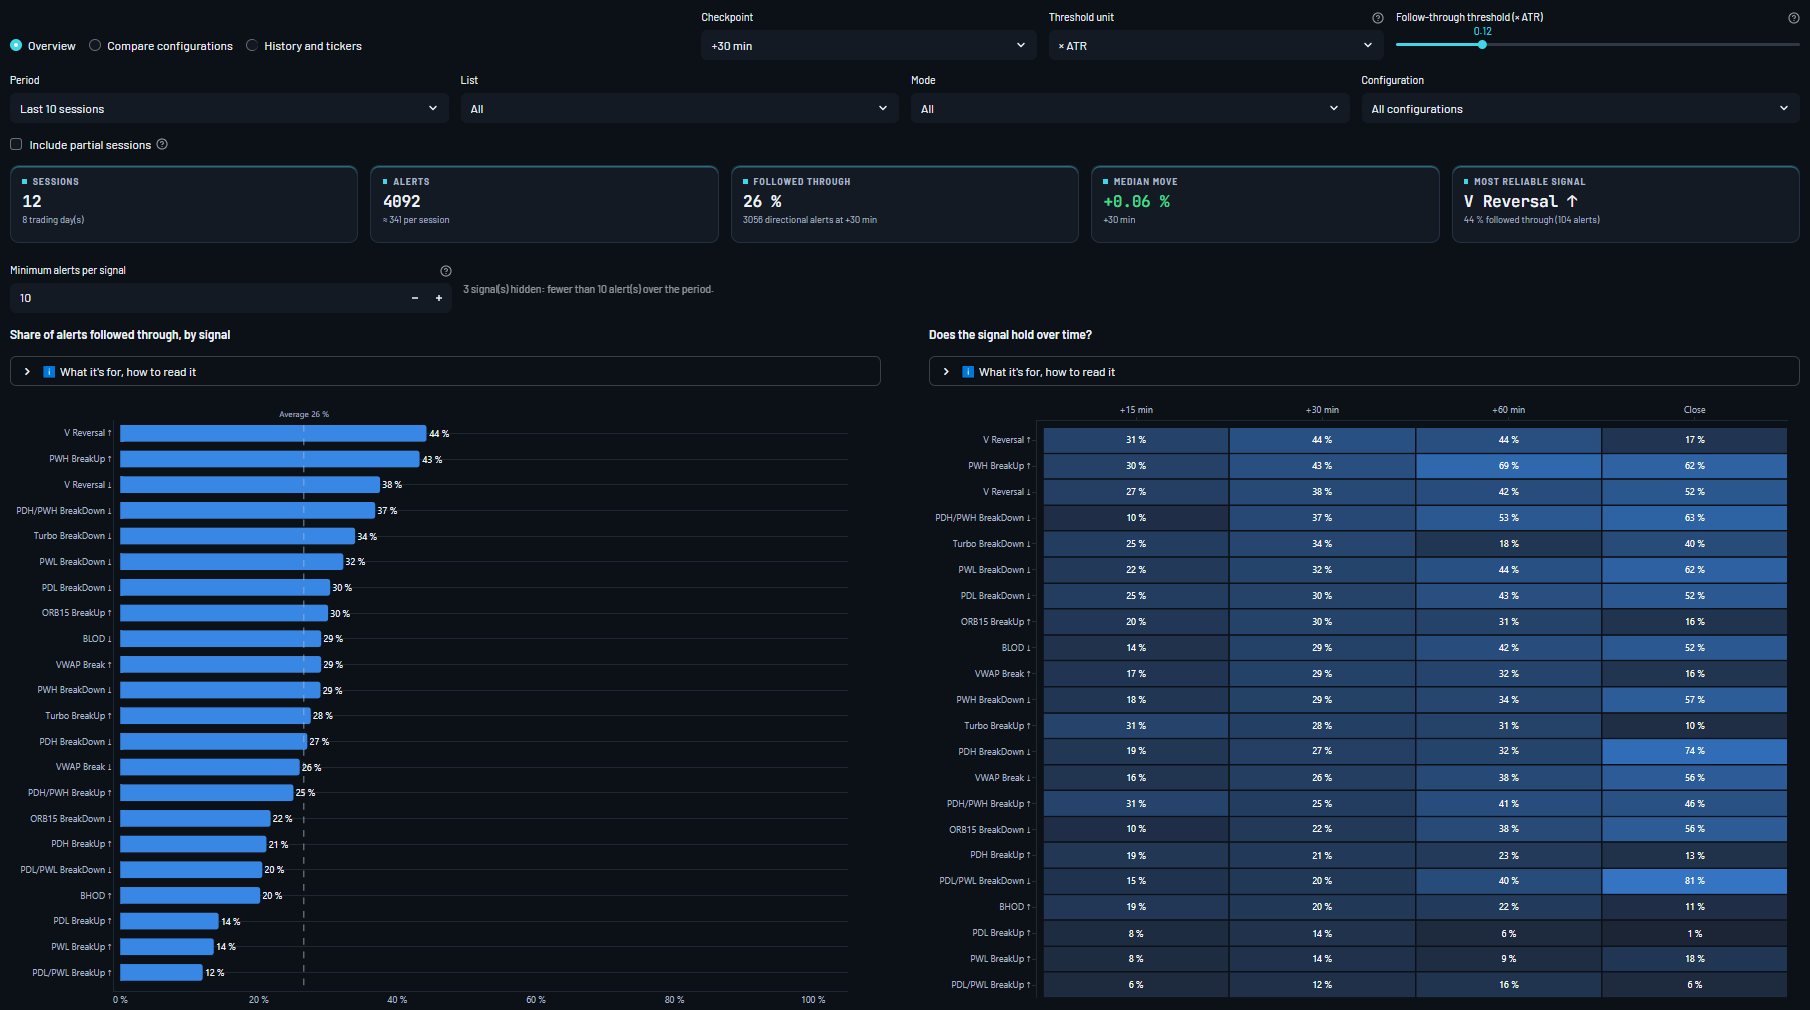
Overview
Filters: period (5 to 90 sessions), list, mode (Backtest, real time) and configuration. You get the number of sessions and alerts, the share of alerts followed through, the median move, the most reliable signal, then:
- Share of alerts followed through, by signal, and Does the signal hold over time? (share followed through at +15, +30, +60 min and at the close: the more intense the cell's blue, the more the move holds);
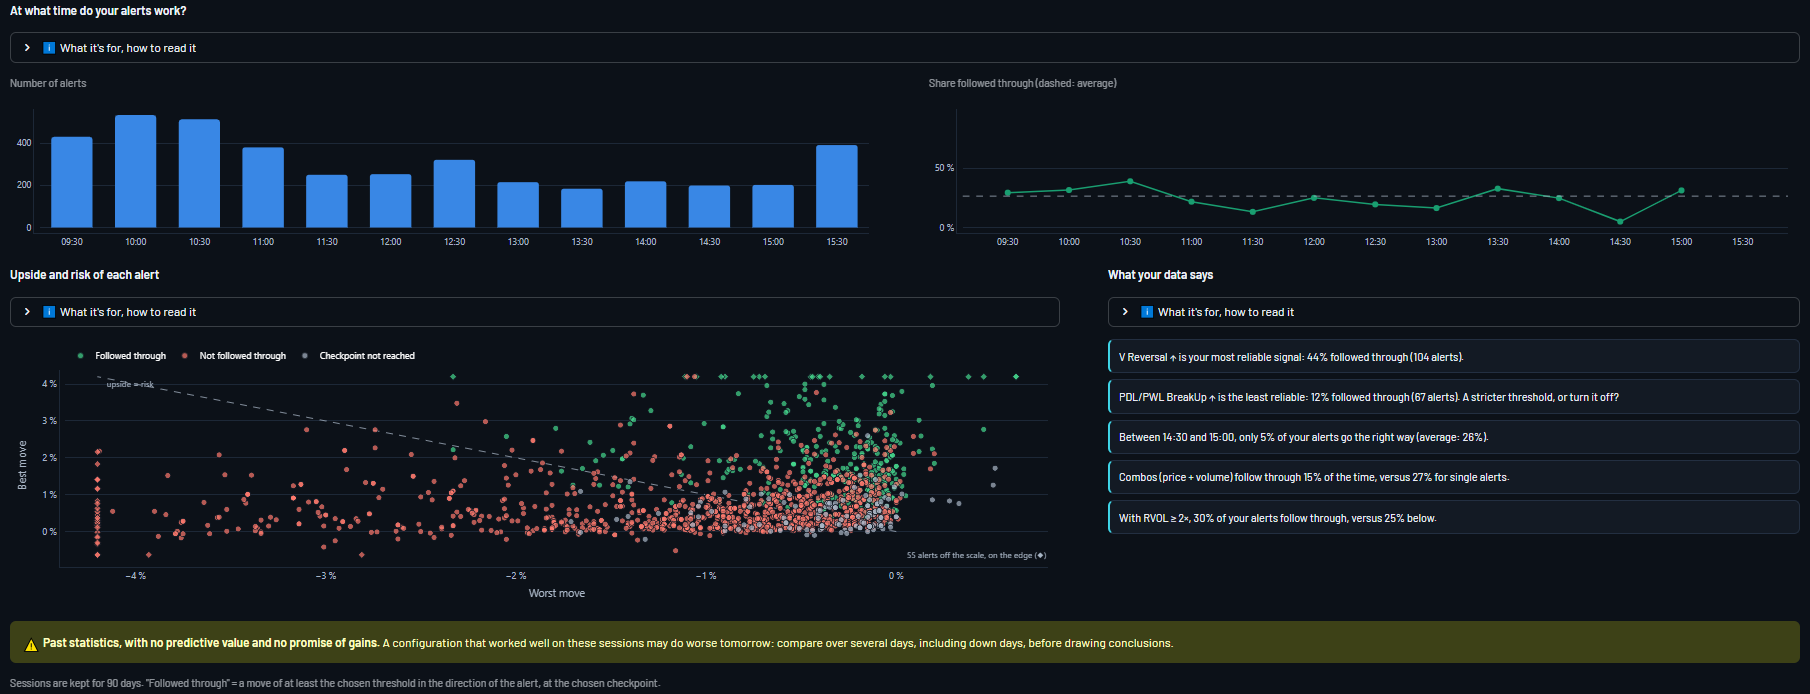
- At what time do your alerts work? number of alerts and share followed through by half hour of the session;
- Upside and risk of each alert: best favorable and worst adverse move within the following hour;
- What your data says: a few plain-language findings (most and least reliable signal, weak half hour, effect of combined alerts and RVOL), only when there are enough alerts.
Compare configurations
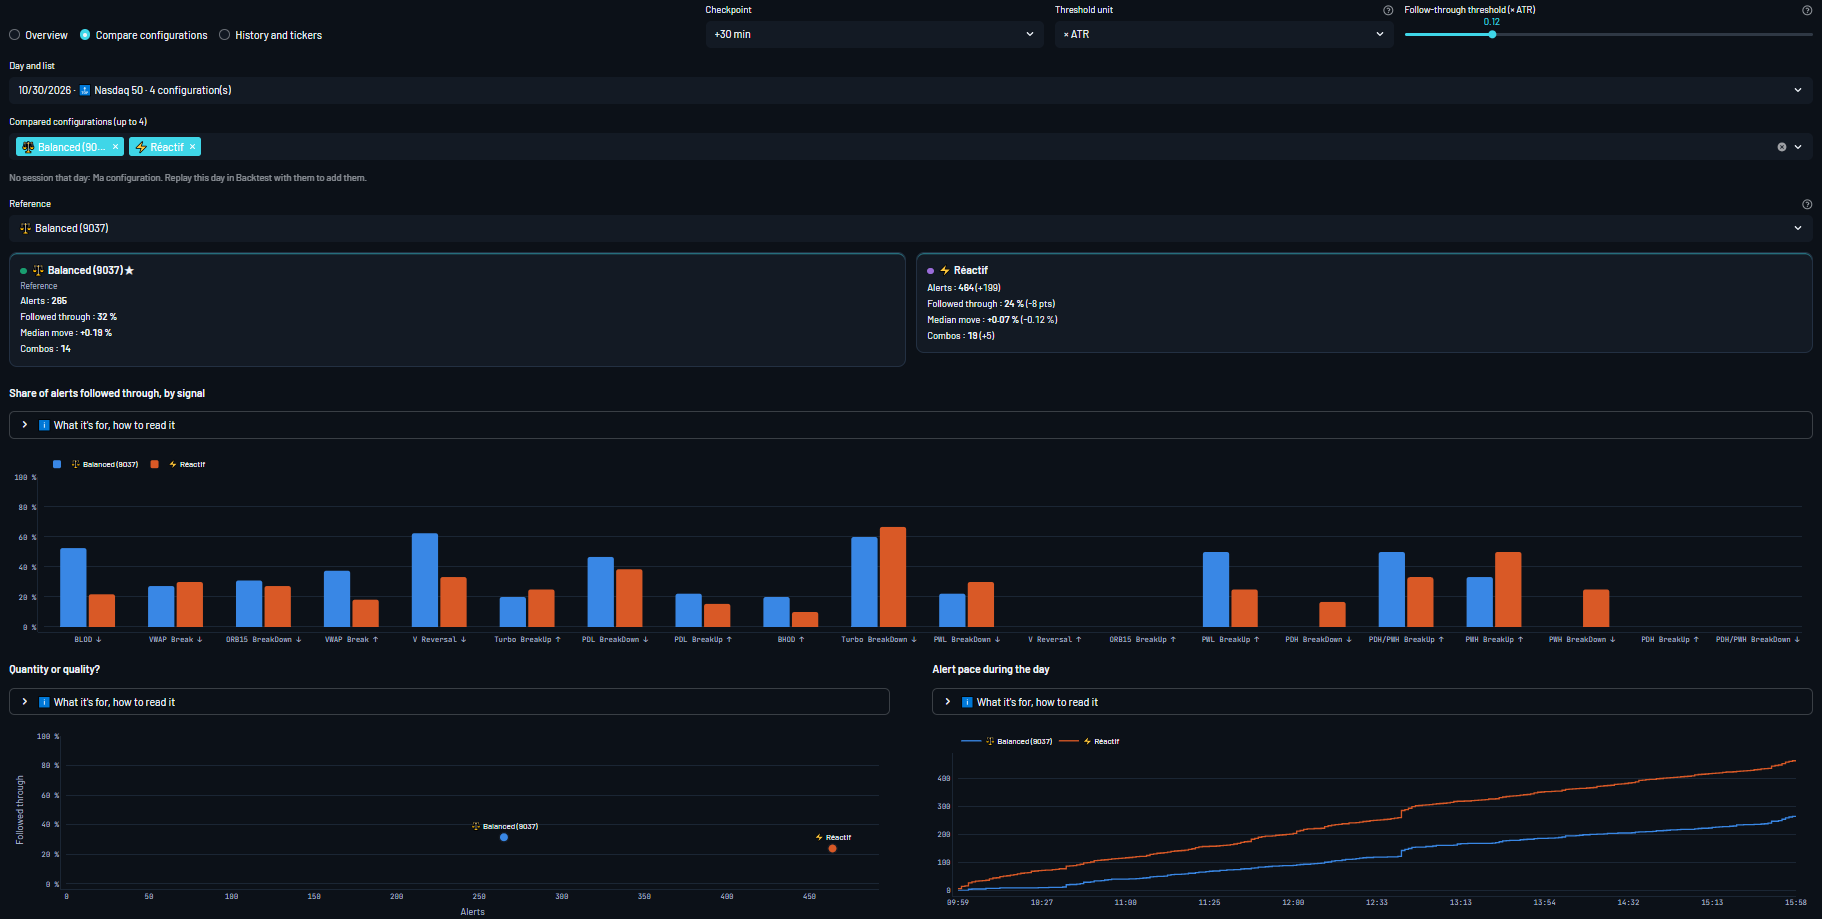
Replay the same day in Backtest, on the same list, with several configurations ("Default" included), then pick that day and list: 2 to 4 configurations side by side.
- Reference: each configuration's differences (alerts, share followed through, median move, combos) are shown in brackets against it; "Default" by default. ★ = best share followed through.
- Quantity or quality? (number of alerts and share followed through), Alert pace during the day, Same alerts or not? (common, shared, unique) and What sets the configurations apart: only the settings that differ.
- Configurations without a session that day are listed: replay the day with them to add them. A partial session is flagged in the selection and on its card; if periods differ, the comparison covers the common period.
History and tickers
- Your configurations over time: share followed through session by session. Grey bands mark sessions where the list went down, so the market trend is not mistaken for the quality of your settings; a marker flags changed settings of a configuration.
- Tickers: alerts, share followed through, median move and ATR of each ticker, with its best signal.
- Saved sessions (full ✅ or partial) and the 🗑️ Delete a session panel: all your sessions, partial ones and duplicates included, with the time they were saved; deleted after confirmation.
These are past statistics, with no predictive value and no promise of gains. Compare your configurations over several days, including down days, before drawing conclusions.
📊 Alert Display
Market line (top right): New York open (green dot) or closed (red dot), based on the exchange calendar (holidays, early closes; session hours on hover), and the Nasdaq-100: change since the previous close and a mini chart of the day, on the scale of the whole session (dotted line = previous close). In Backtest, everything follows the simulated minute (BACKTEST label).

At all times, the banner sums up the session in five cards:
- Monitored tickers: number of tickers, with the list and the mode (real time or Backtest);
- Alerts generated: number of alerts, with the latest one (ticker, time, type, Chg%);
- ⚖️ Bias ▲: share of directional alerts that are bullish over the session, then over the last 30 minutes; two bars (session, 30 min); red below 40%, orange from 40 to 60%, green from 60%; the arrow compares the 30 minutes with the session (↗ more bullish, ↘ more bearish, → similar, within 5 points); volume and RVOL not counted;
- System status: ACTIVE / STOPPED, with the settings style and the threshold unit;
- Last scan: time of the last scan (simulated minute in Backtest); the bar empties until the next scan.

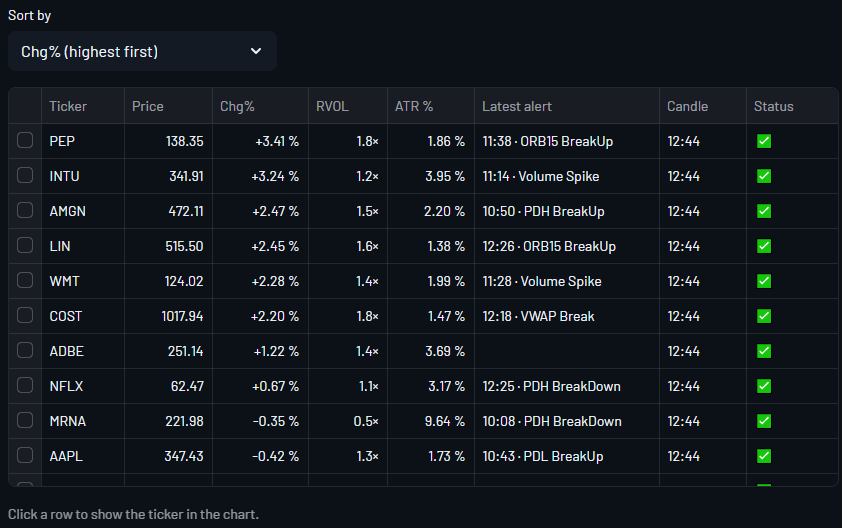
Hover over the Monitored Tickers card to read the list of tickers. Just below, the 👁️ Monitored tickers switch opens a table of all your tickers: last price, Chg%, RVOL (depending on your plan), ATR % (× ATR thresholds), latest alert (time and type), time of the last analyzed candle and status (✅ analyzed, ⚠️ no data yet, ⛔ unknown ticker). The Sort by menu sets the order (Chg%, RVOL, ticker or latest alert), kept from one scan to the next and after a page reload. Click a row to show that ticker in the chart.
Session timeline
Below the banner, the timeline shows the whole day, from 9:30 AM to 4:00 PM (New York time): the Session lane (elapsed time and ORB window), then one lane per signal family (Volume, RVOL, Key levels, Breakouts, Momentum). The small blue tick marks the first candle where the family can alert with your settings ("off": family turned off; "not in plan": not included in your plan). Each alert is marked at its minute: ▲ bullish, ▼ bearish, ● no direction; the vertical line shows the current minute. The hatched 3:59 PM area is a reminder that no alert is given on the closing auction candle.
Hover over a marker to read the alert; click it to show the ticker in the chart, centered on that minute. Click "The session" header to collapse or expand the timeline (choice kept in your browser).

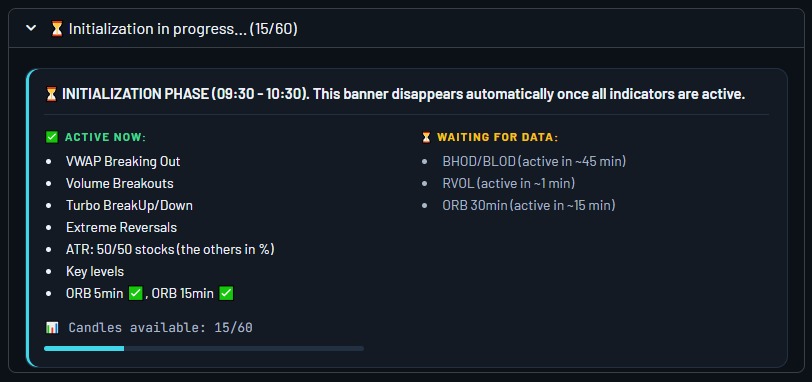
During the initialization phase, which covers the first 30 minutes after the market opens, the following banner shows the progress of the various indicators that generate alerts.
Fully operational indicators are shown on the left, the others on the right with the time left; the bottom bar follows the number of candles available.
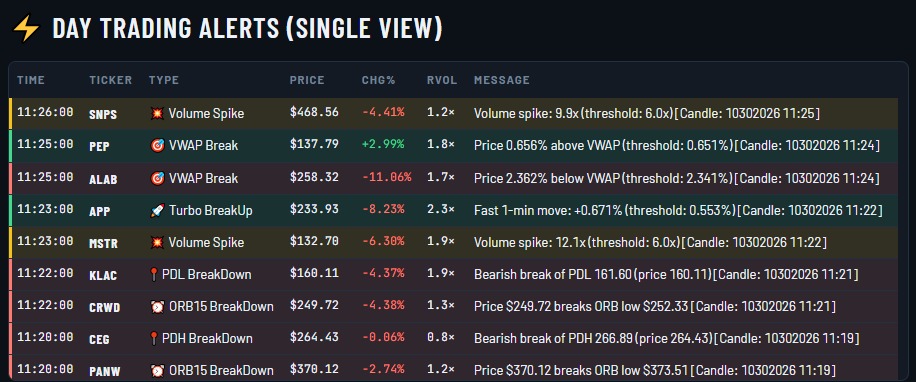
SINGLE view
For each alert, you see the scan time, the ticker, the alert type, the price in $ and the price change in % (since the previous day's close) at the last closed candle, plus the alert message with the analysis details and the time of the triggering candle.
DOUBLE view
Same information as the SINGLE view, displayed in two columns for better readability.
Intraday chart
Below the alerts or on the right, the chart of the selected ticker: 1-minute candles, VWAP, ORB levels, key levels (purple dotted lines), high and low of day, and alert markers (▲ bullish, ▼ bearish), then the ticker portrait. See the Intraday chart section.